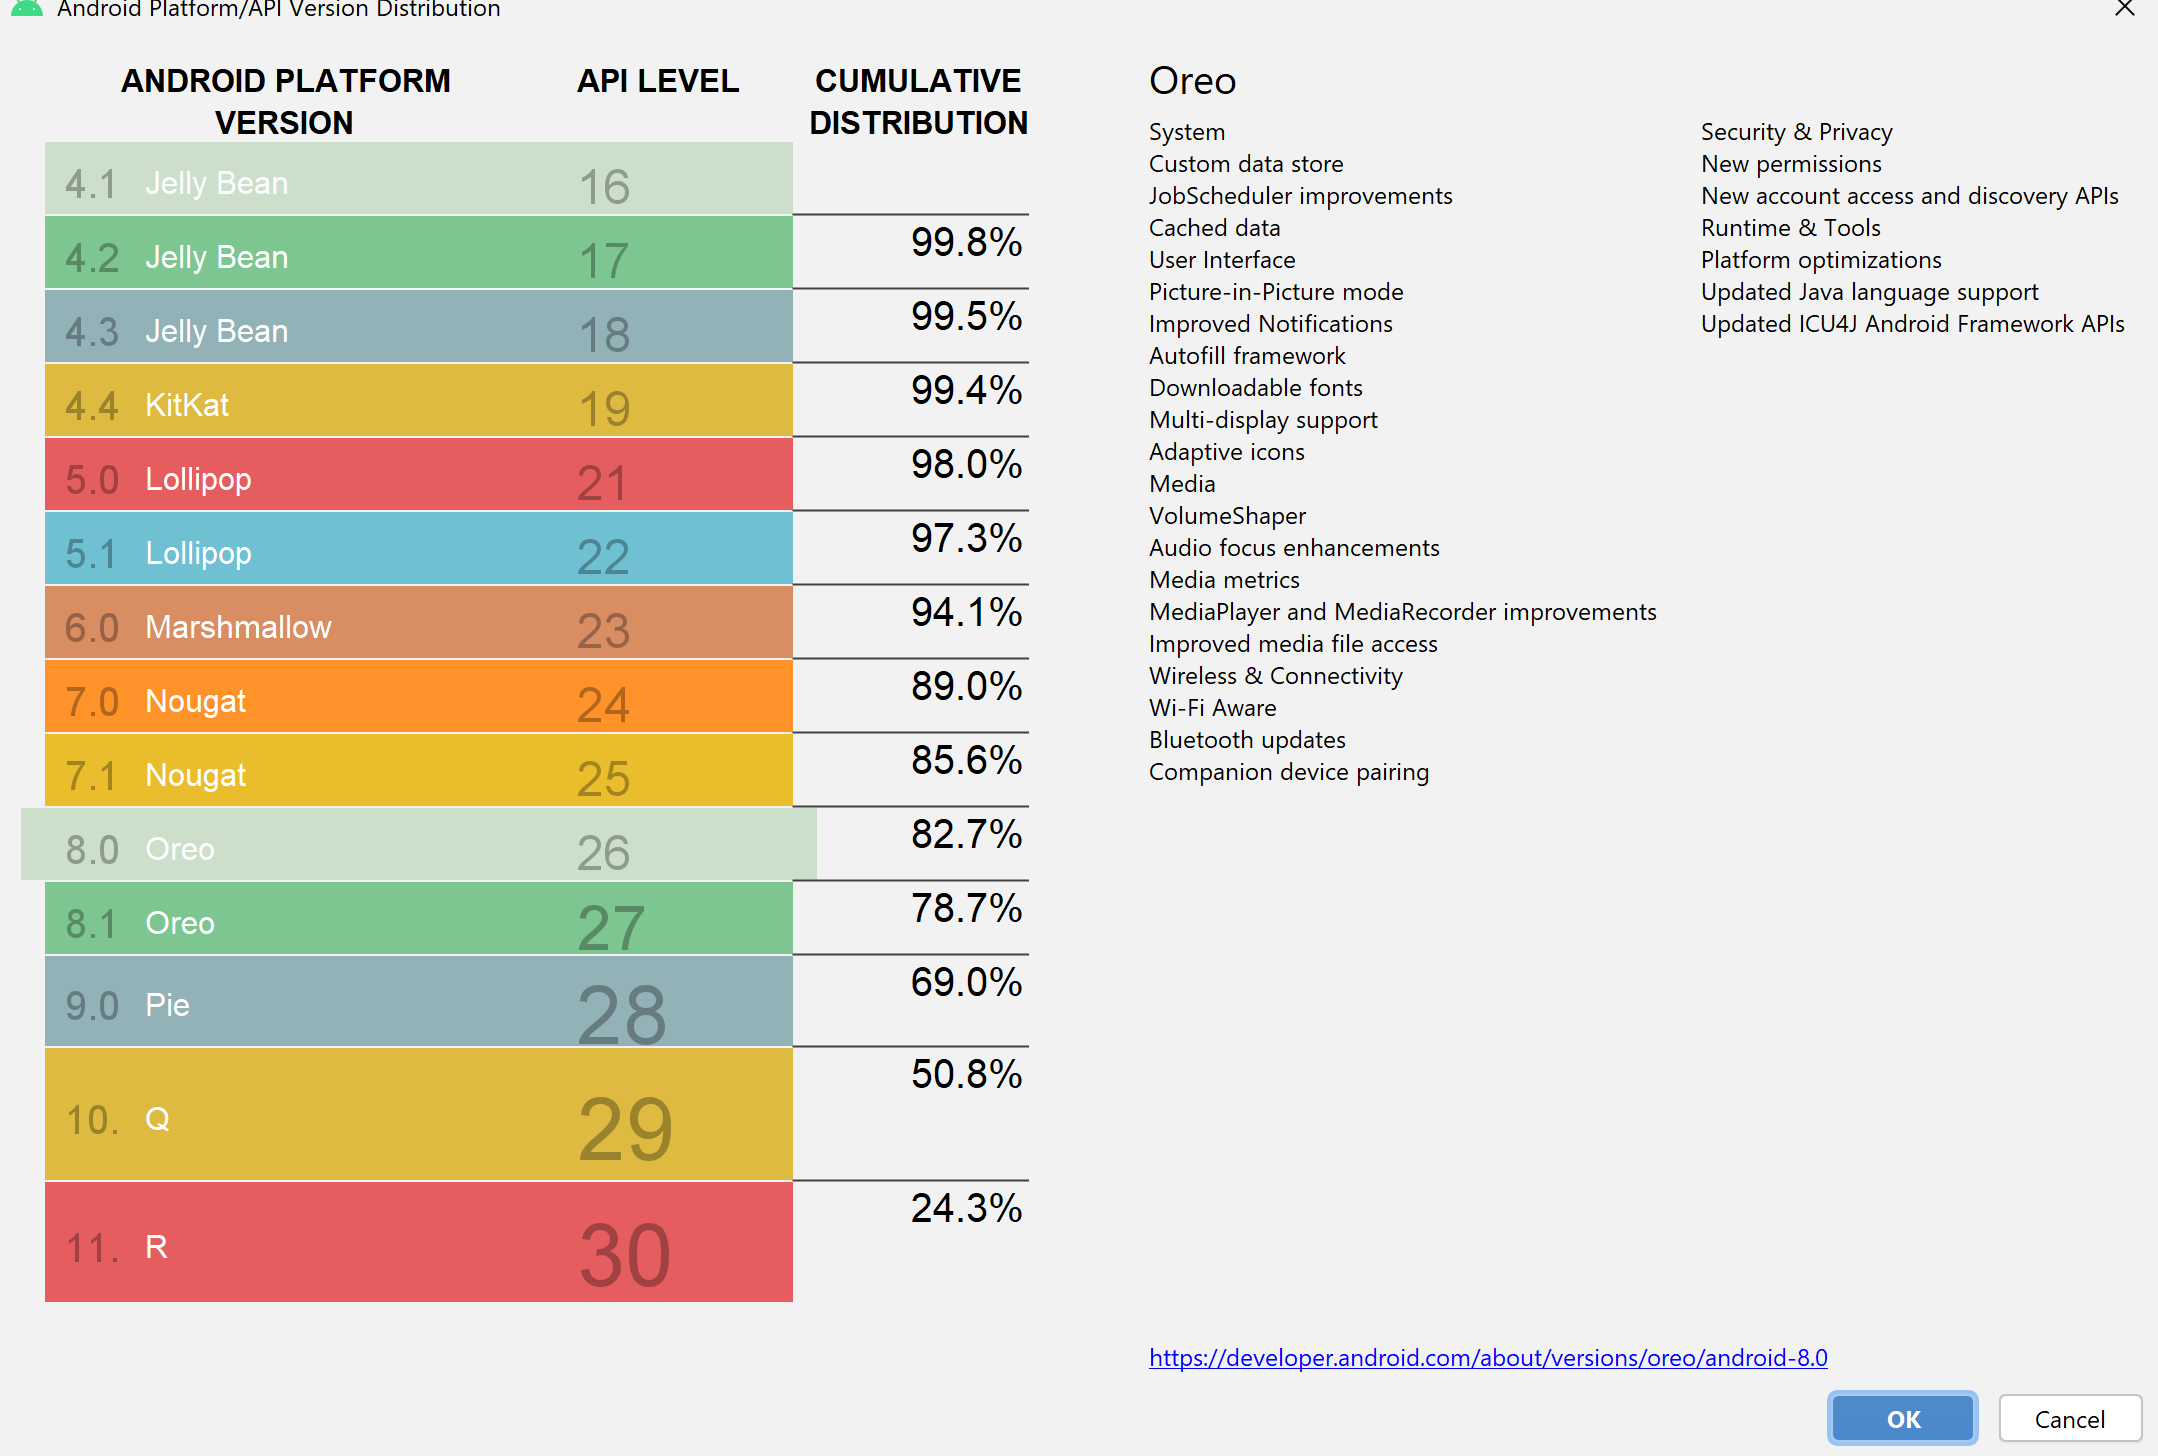
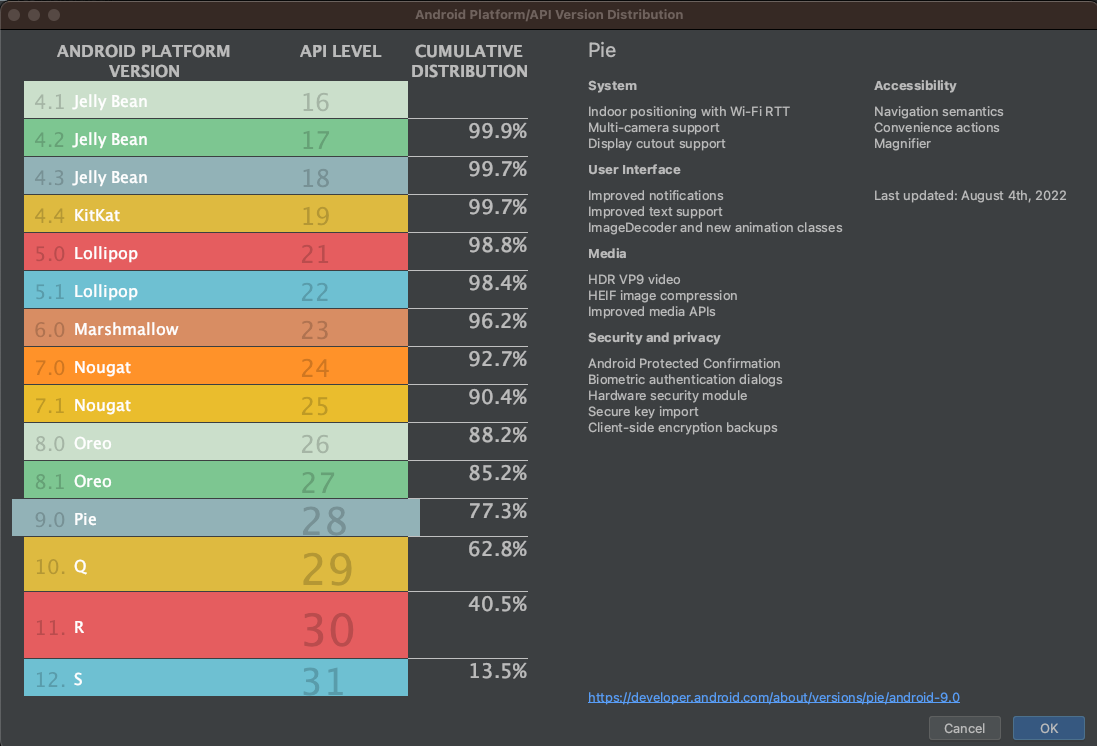
As the Google dashboards page has stopped giving version percentages for some time, years to my memory, I thought I'd give an updated answer to this salient issue. First off, when you create a new project, on the screen where you enter your minimum sdk among other items there is a 'help me choose' link which will bring you to a list of android version use percentages, info similar to that given in the old dashboard pie chart. Also similar to the old dashboard chart, it is terribly obsolete.
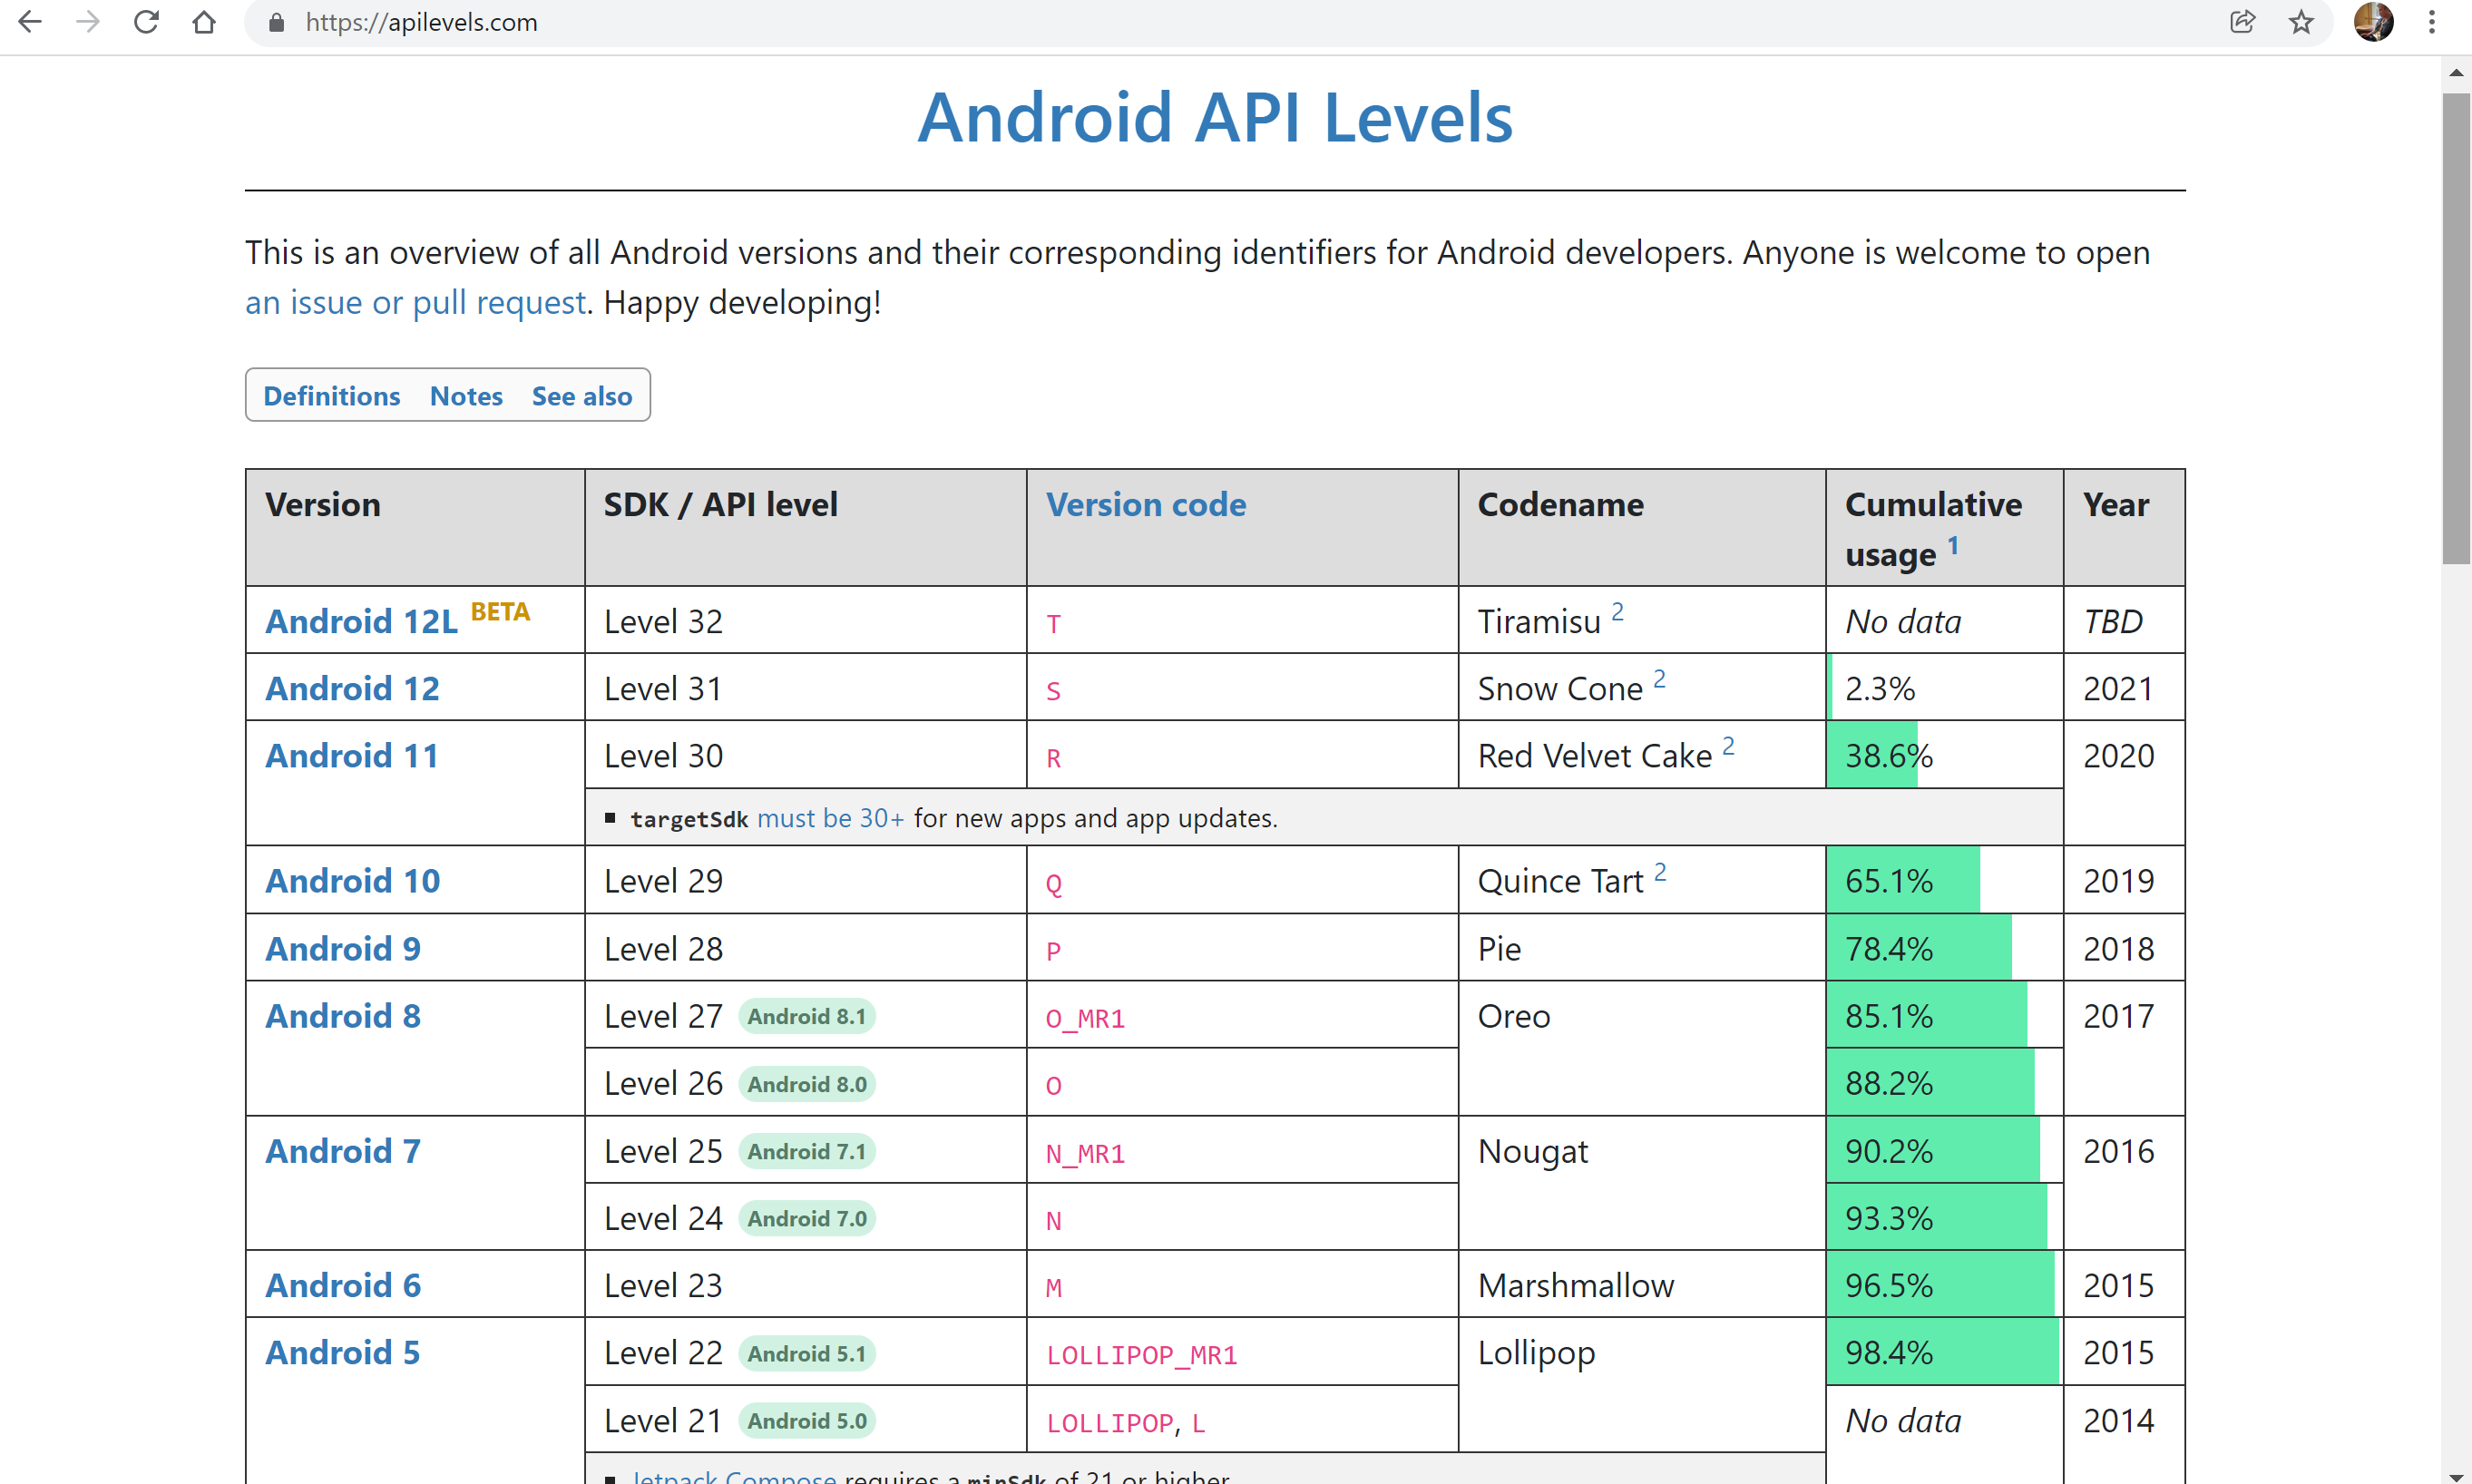
Websites with current use version info include https://www.appbrain.com/stats/top-android-sdk-versions, https://gs.statcounter.com/os-version-market-share/android/mobile-tablet/worldwide, and https://apilevels.com/. The latter appears to give the most current numbers.
Android Studio Chart - Obsolete

apilevels.com - Current as of Jan 6 2022 on this writing Jan 23

I use the Pareto Principle, that roughly 80% of consequences come from 20% of causes, in determining the percentage of devices to support. In this case, 80% of the issues (and potential 1 star ratings) come from the bottom 20% of android API levels. I found this out the hard way starting out. My minSdkVersion is now 28, which still covers the top 78.4% of android versions according to apilevels. Coincidentally, android tends to support only the top 80% of API levels, so that could be another metric for the 80/20 maxim. Oreo is no longer supported.


